

Share this
by Wealthstone Group on Oct 16, 2026
I've Grown: Value, Rates and the Mood Gap
“I'm not the same person I was five minutes ago. I've grown.”
Brennan Huff, Step Brothers (2008)
Executive Summary
Brennan Huff's growth spurt took five minutes. Markets in 2026 have reinvented themselves almost as quickly. Value stocks have beaten growth stocks by a wide margin, bond yields have climbed to levels not seen in roughly two decades, and consumers say they feel about as gloomy as they ever have, even as corporate profits surge.
-
Value did the growing: The Russell 1000 Value has outpaced the Russell 1000 Growth by about 17 percentage points this year, driven more by stock selection than by sector bets.
-
Trend and price led: Stocks with strong recent momentum and attractive valuations were the year's best-performing factors, while defensive, low-volatility stocks lagged.
-
Inflation is personal: Overall prices are up about 9% since the end of 2023, but coffee is up 53% and gasoline 39%, and that gap shapes how households feel.
-
Sentiment is not a strategy: Consumer sentiment sits near record lows while S&P 500 earnings estimates have climbed sharply.
Performance
Value ran away with the year. Through October 15, the Russell 1000 Value returned 22.25% year to date versus 5.44% for the Russell 1000 Growth and 13.76% for the S&P 500, though growth did lead over the past month (2.56% versus -0.11%). Abroad, emerging markets gained 20.26% and developed international markets 9.30%, though both slipped over the past month.
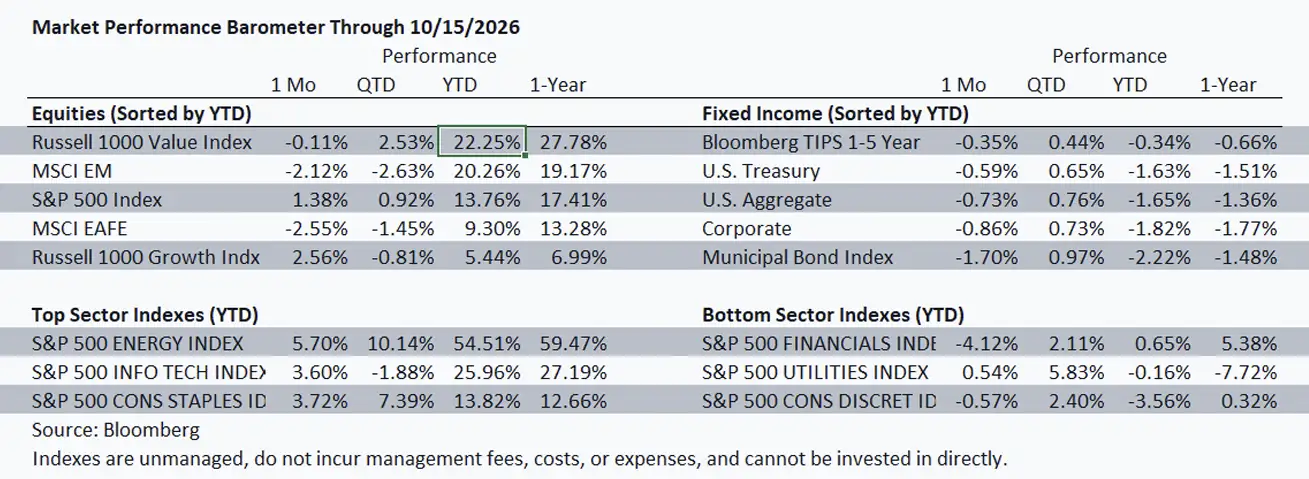
Chart: Value, energy and emerging markets have led in 2026, while bonds have been held back by rising yields.
Sector results were unusually far apart. Energy (54.51%), Information Technology (25.96%) and Consumer Staples (13.82%) led, while Financials (0.65%), Utilities (-0.16%) and Consumer Discretionary (-3.56%) trailed. Bonds have had a tougher year as rising yields pushed prices lower: the U.S. Aggregate is down 1.65%, Treasuries -1.63%, Corporates -1.82% and Municipals -2.22%, with short-term TIPS (-0.34%) holding up best. Encouragingly, every major bond index is positive for the quarter so far, a reminder that higher yields eventually work in a bondholder's favor.
Value Did All the Growing
The irony of 2026 is that the index named for growth did the least growing. Our attribution analysis compares the Bloomberg 1000 Value with the Bloomberg 1000 Growth year to date through October 15. Because it works from each index's holdings rather than its official returns, the totals carry some noise and won't match published figures to the decimal, but the story is clear: value's lead came from what it owned within sectors, not from how it was weighted across them. Stock selection added roughly 11 percentage points, while sector weighting subtracted roughly 5, mostly because value indexes hold far less technology than growth indexes do.
The leaders might surprise anyone who pictures value as banks and pipelines. Micron topped the list, with Intel and Dell close behind, meaning value captured part of the semiconductor and hardware rally through names that sit on its side of the style line. Energy companies such as Marathon Petroleum, Chevron and Valero added further gains, while the detractors were small and scattered across banks, telecom and consumer staples. Style labels, in other words, can hide where returns actually come from, which is why we look at exposures across styles and sectors together rather than relying on any single label.
Riding What Works, Paying Less for It
Factor analysis offers another way to see the year. It sorts the market by characteristics, such as how cheap a stock is or how strongly it has been rising, and measures how the best-scoring group performed. In 2026, the top quintile of U.S. stocks ranked on momentum returned 18.2% year to date and the top quintile ranked on valuation returned 17.1%, both well ahead of the S&P 500's 13.8%. Large-cap, value, growth and profitability screens landed in a middle pack between 11% and 13%, and quality returned 9.7%. The clear laggards were the defensive groups: low-volatility stocks gained just 4.7% and mid caps 5.1%.
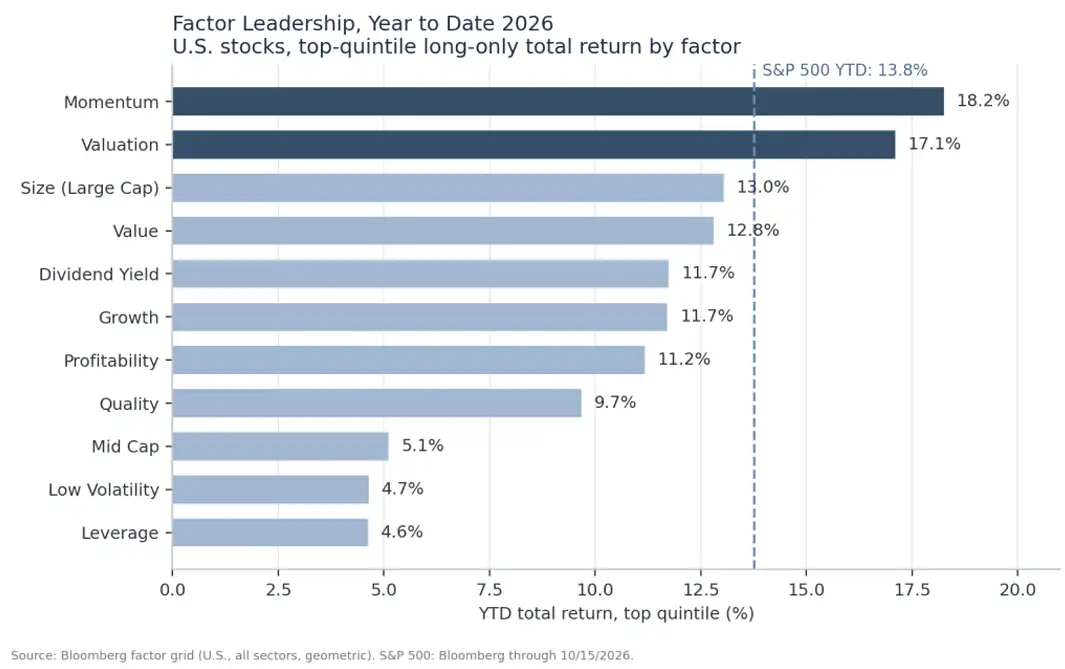
Momentum and valuation led this year, while defensive, low-volatility stocks lagged.
Two takeaways stand out. First, the market has rewarded trend and price rather than safety, a pattern that tends to persist until it doesn't; in the most recent week, the momentum group fell 3.3% while the low-volatility group rose 2.6%. Second, the growth factor's 11.7% gain is more than double the growth index's 5.44%. The two are built differently, so the comparison is approximate, but it suggests growth as a characteristic held up reasonably well and the index's heavy concentration in a handful of mega-cap names did more of the damage. Because factor leadership can rotate this quickly, we believe spreading exposure across several factors is a sturdier approach than leaning hard into whichever one led last.
The Grocery Receipt Problem
Official inflation statistics and the checkout line tell different stories. Since the end of 2023, the overall Consumer Price Index has risen about 8.9%. Over the same stretch, coffee prices are up 53.2%, gasoline 39.4% and steak 19.2%, while white bread is actually down 9.6%. Gasoline jumped sharply in the spring as Middle East tensions lifted oil prices and remains elevated. Households experience inflation through the things they buy every week, not through a national average, which helps explain why one-year consumer inflation expectations have climbed to 4.7% and why business surveys show price pressure building: the ISM services prices index reached 74.0 in September, its highest reading since July 2022.
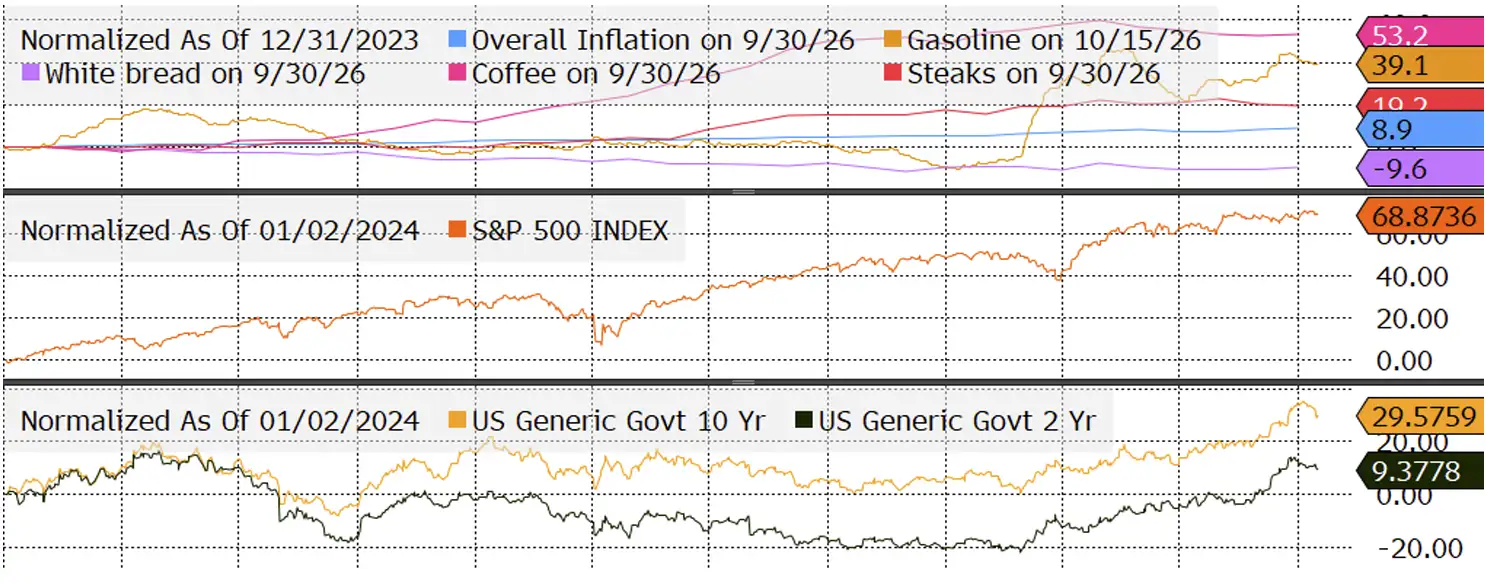
The prices households see most often have risen far faster than overall inflation, while stocks have kept climbing.
The Federal Reserve has responded. It raised its policy rate in September to a range of 3.75% to 4.00%, and futures markets now price roughly a 27% chance of another increase at the October 28 meeting, about one full additional hike by December, and close to three by late 2027, which would take the policy rate to roughly 4.66%. With inflation running unevenly and the Fed still tightening, we would rather be paid well for income than take on more interest-rate sensitivity than necessary.
Not the Same Bond Market
It Was in January Few corners of the market have changed character as quickly as bonds. The 10-year Treasury yield has risen more than a full percentage point this year to above 5%, touching its highest level in roughly two decades. Most of that move has come from higher real yields, meaning the return investors demand above inflation, rather than from rising inflation expectations alone. Markets have gone from pricing rate cuts to pricing a meaningful series of hikes, and several large asset managers have argued recently that this pricing may have moved further than the economy warrants. They point out that today's higher starting yields provide a much larger income cushion against further rate increases than investors had a few years ago. For bond investors, that changes the math. Shorter-term bonds now offer income that is competitive with longer maturities, with considerably less price sensitivity (what investors call duration) if rates keep rising. Credit markets call for care as well, since the extra yield paid for corporate risk remains thin and careful issuer selection matters more than broad exposure. The tax-exempt municipal market arguably allows fallow for longer duration with taxable equivalent yields for investors in the highest tax bracket exceeding 7%. That combination is why AMS is leaning somewhat shorter in duration with new fixed income additions, locking in attractive income while limiting exposure to longer-term fiscal and rate uncertainty.
Mood Ring Meets Earnings Report
If markets followed how people feel, 2026 would have been a rough year. The University of Michigan's preliminary October consumer sentiment reading fell to 46.3, its third straight decline and not far from the record low set in May. Yet the S&P 500 is up 13.76% this year and, as the lower panel of the inflation chart shows, roughly 69% since the start of 2024. Earnings explain much of that gap. According to FactSet, S&P 500 companies beat second-quarter profit estimates by 26.0%, the largest margin in a decade; analysts have raised full-year 2026 earnings estimates by 15.6% since February, from $313.72 to $362.65 per share; and third-quarter earnings are expected to grow nearly 30%.
The disconnect is less strange than it looks. Sentiment surveys measure how households feel about recent prices and their own finances, which is why they tend to sag when gasoline and grocery bills climb. Markets look ahead and price expected corporate profits. By the time sentiment is at its bleakest, much of the bad news is often already reflected in prices, and the reverse is true when readings turn euphoric. In our view, sentiment is a useful read on the mood of the past few months and a poor guide to the next few years.
That doesn't mean everything is rosy. Earnings strength is concentrated: the median company beat estimates by just 5.8%, and Technology, Communication Services and Consumer Discretionary generated roughly 75% of total earnings growth. Several of the largest companies report on October 28 and 29, and those results will test whether the profit surge can broaden. We would rather let earnings, valuations and diversification guide portfolio decisions than headlines or moods, while staying alert to how narrow this year's profit leadership has been.
Growth on a Longer Clock
Brennan claimed his growth spurt in five minutes. Real portfolio growth takes longer, and as this year's value-versus-growth scorecard shows, it rarely comes from where the label suggests. Markets will keep reinventing themselves every quarter, sometimes every week. Our positioning is deliberately steadier: an unchanged domestic equity allocation relative to Treasuries, modestly shorter duration on new fixed income additions, and diversification across styles, factors and asset classes. In our view, that is how investors actually grow: five years at a time, not five minutes.
Louis Tucci; Partner | Senior Investment Advisor
Paulo Aguilar, CFA, CAIA; Partner | Senior Investment Advisor
Mark H. Tucker, CFA; Chief Investment Officer
Mason King; Portfolio Manager
Securities offered through Arkadios Capital. Member FINRA/SIPC. Advisory services through Arkadios Wealth.
Past performance does not guarantee or is indicative of future results. This summary of statistics, price, and quotes has been obtained from sources believed to be reliable but is not necessarily complete and cannot be guaranteed. All securities may lose value, may not be insured by any federal agency and are subject to availability and price changes. Market risk is a consideration if sold prior to maturity. Information and opinions herein are for general informational use only and subject to change without notice.
This material does not constitute an offer to sell, solicitation of an offer to buy, recommendation to buy, or representation as the suitability or appropriateness of any security, financial product or instrument, unless explicitly stated as such. This information should not be construed as legal, regulatory, tax, personalized investment, or accounting advice.
The information is current only as of the date of this communication and we do not undertake to update or revise such information following such date. To the extent that any securities or their issuers are included in this communication, we do not undertake to provide any information about such securities or their issuers in the future. The views expressed reflect the author(s) personal view and not the view of Arkadios Capital or Arkadios Wealth. This report is provided on a “where is, as is” basis, and we expressly disclaim any liability for any losses or other consequences of any person’s use of or reliance on the information contained in this communication.
Any Arkadios model portfolio holdings and benchmark data are for illustrative purposes only and should not be construed as any type of research. This data is not meant to replace Adviser’s portfolio management/performance reporting systems or brokerage statements. Please consult your reports for actual performance data before making any decisions based on this information. Accordingly, reliance upon information in this data is at the sole discretion of the reader. Assumptions on returns are just that and may or may not come to fruition. Actual returns may not be as projected and are for illustrative purposes only.
Forecasts, projections, and forward-looking statements are based on current assumptions and, expectations and are subject to change, and actual. Actual results may be materially different.
International and emerging market investments involve additional risks including currency fluctuations, political risk, and differing accounting standards.
Bond prices generally move inversely to interest rates. Rising interest rates may cause bond prices to decline. Performance data reflects market index returns through October 15, 2026. Sources include Bloomberg, FactSet, Morningstar Direct, and other third-party providers believed reliable. Index performance is not indicative of future results and investors cannot invest directly in an index.
Probability estimates referenced herein are derived from market-implied pricing, futures markets, prediction markets, or thirdparty research and do not represent forecasts by Arkadios. Such estimates may change significantly and are not guarantees of future outcomes.
Certain probability estimates are derived from publicly available prediction markets whose methodologies differ from traditional economic forecasting tools.